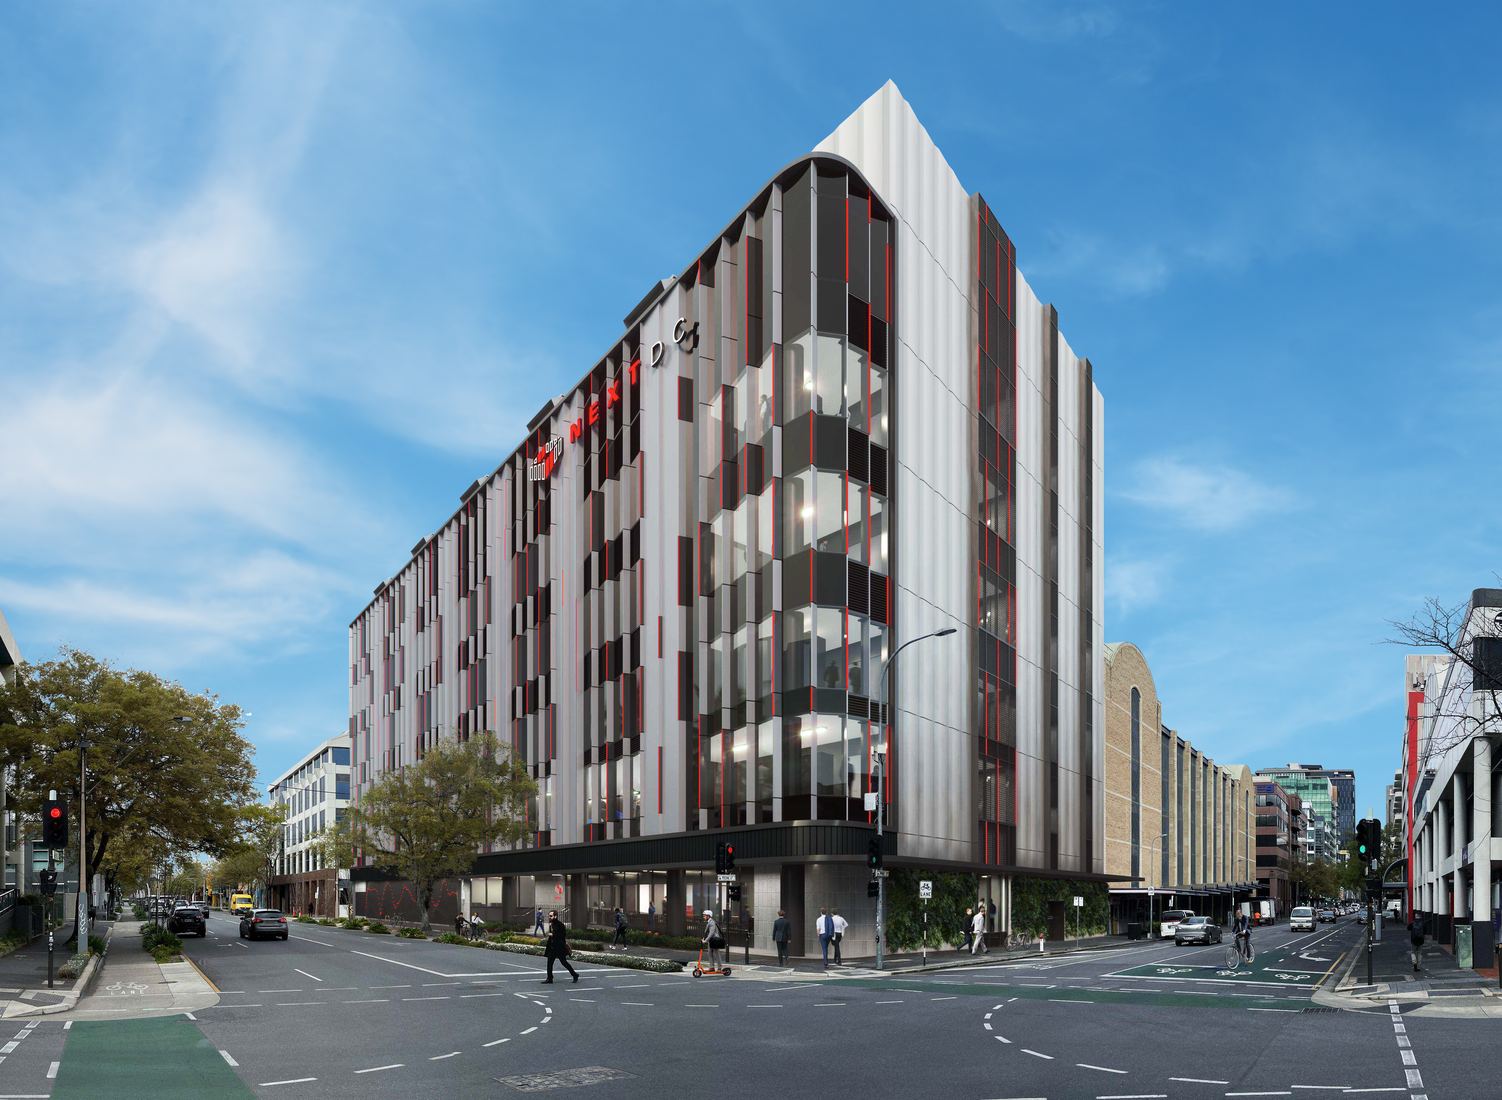
NEXTDC A1 Adelaide
NEXTDC · Adelaide
- IT live
- 5 MW
- Free to lease
- 0.6 MW
- $ / kW·mo
- $125
- White space
- 39k ft²
Inventory
88% occupiedPower
5 MWlive
0.6 MW to lease · 4.4 MW in use
White space
39k ft²total
4,687 ft² free · 34k ft² occupied
3,629 m² · 435 m² free
Free power is unsold critical IT at this building, not utility headroom. Space is computer-room white space.
Power
About 1.3 MW of the utility feed is cooling, conversion, and house load.
Power cost
$125/kW·mo
13.4¢ industrial · 17.2¢ after PUE 1.28
- Per MW·year
- $1.5M
- This site · 5 MW
- $7.5M/yr
- 6 kW rack
- $751/mo
4.2× the cheapest market (Iceland Landsvirkjun). Same IT load there is $5.7M/yr less.
NEM industrial · utility tariff × PUE, not colo list price.
- Redundancy
- N+1
- Opened
- 2016
- Renewable match
- 70%
- Rack density
- 6 kW
- PUE
- 1.281.00 ideal · 1.60 typical
- Power source
- SA Power Networks. Wind-heavy South Australia grid.
Cooling
Plant
Free air
Liquid
Not deployed
Rack density
6 kW
H100-eq
—
WUE
2.40 L/kWh
fleet avg · 2026 · 105k m³/yr at 5 MW
Operator fleet average applied to this hall — not a site meter. NEXTDC FY26 sustainability report.
Free-air economization. Only HCF-certified facility in Adelaide.
Network carriers
6On-net and metro carriers typically present at this location, including internet exchanges. Not a full circuit inventory.
Clouds
4Native regions and typical Direct Connect / ExpressRoute / Interconnect on-ramps at this campus. Availability varies by hall.
Location
Adelaide, South Australia, Australia
Adelaide, SA
-34.929°, 138.601° · Oceania
Tenants / users
Enterprise, government
Notes
NEXTDC Adelaide. SUBCO cable landing improves Perth–Adelaide–Melbourne latency.
Compiled from public filings, operator pages, and reporting. Not an official operator specification.